Preliminaries
First of all: Since this is supposed to be a quick guide to using Bugaboo many tips are scattered around. So it is recommended to take your time and read through all of this document without skipping anything.
Even when starting Bugaboo there is some sort of flexibility! Well, not built in really, but using an external program provided in the Turbo Assembler package (L_XXXXXX.PRG), you can load Bugaboo to any possible address from start of program area up to the Physical screen. This is very handy especially when you have lots of memory because you can load it high enough so it won’t interfere with a code you’re trying to trace through and it has to load at a specific address.
Also, renaming BUGABOO.PRG to BUGABOO.TTP (or BUGABOO.GTP for later TOS versions) you can invoke the debugger and have it execute any cli command immediately. Quite handy for scripting. (Thanks to tIn/Newline for the tip)
Bugaboo is a very special debugger in my opinion, as you can use it using shortcut keys AND/OR CLI commands. When you load it you can see the top 2 lines containing 20 useful functions. These can be invoked using F-keys (top line) and Shift-F-Keys (second line). Or you can click the text buttons with your mouse if you feel civilised enough. Let us briefly cover the most important of those functions.
The top bar

- Trace (F1): Well, it traces thru a single command. Enters bsr/jsr subroutines too.
- Do PC (F2): Executes the code until the next command relative to the current is reached. So you can pass a dbra loop without having to trace each step. Useful!
- Tracrts (F3): Traces until an RTS instruction is reached. So you can quickly pass by a subroutine. CAUTION! You should use this BEFORE the stack is tampered by the subroutine!!! So if a subroutine immediately saves registers to the stack you must press F3 before this happens, or else you’ll most probably bomb out!
- Ttraps (F4): Identical to Trace, but lets you enter a trap vector and trace it. Useful for tracing through O/S or a custom trap.
- Skip PC (F5): Just skips to the next instruction.
- Source (F6): If you assemble a source from Turbo Assembler to Bugaboo then you can see the source this way.
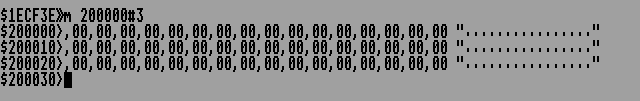
- Hexdump (F7): Produces a hex dump of the memory at PC. Also you can use the ’m’ command on the CLI. Just type
m <address> [#no_of_lines_to_display]So, typingm $200000will produce a memory dump of $200000 onwards. However if you only need to display 3 lines (this is mosty because you don’t want to overwrite other information being displayed) you can usem $200000#3
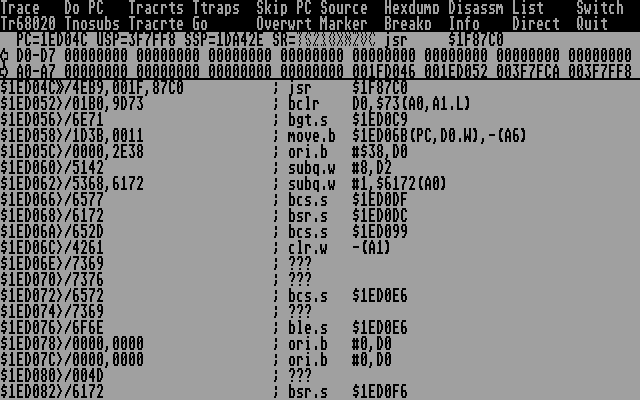
- Disassm (F8): Produces a diassembly of the memory at PC. Like F7 there is a CLI equivalent:
d <address> [#no_of_lines_to_display] - List (F9): Produces a re-assembly of the memory at PC. Like F7 and F8 we have:
l <address> [#no_of_lines_to_display]
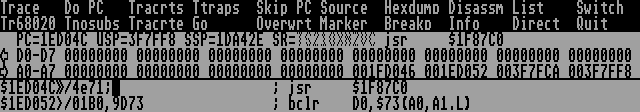
Now, when you press F7, F8 or F9 you will see a listing that resembles these:
F7:

F8:
F9:
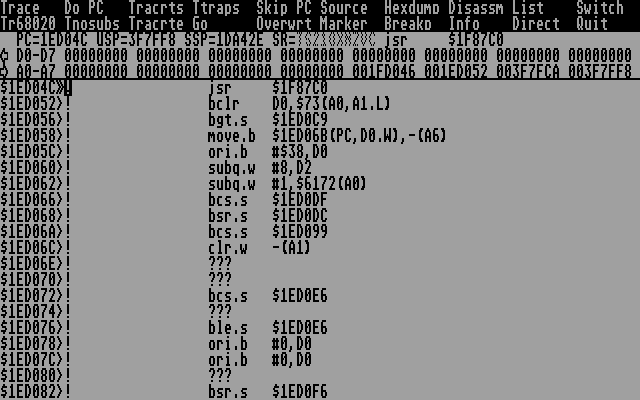
What Bugaboo does here is to provide the listing in CLI style. This is default and I don’t think it can be changed. What most people don’t realise here is that what is printed there can be changed at will. In fact you don’t need to type any command to change any memory place, if you know the syntax. Let’s break the lines down a bit. (taking F8 as an example)
$1ED04C> This is of course the memory address. The ‘>’ is essential for Bugaboo to parse the command properly. When you see a ‘»’ character it means that the Program Counter is in that address.
/4EB9,001F,87C0 This is the disassembled opcode.
; jsr $1F87C0 This is actually a comment just to help you since this is the disassembly view.. Bugaboo stops parsing a line when it encounters the 1st ‘;’. In this case it shows you the instruction at that address.Modifying the instruciton in the comment and hitting return won’t change anything. (We’ll get to changing instructions in a bit)
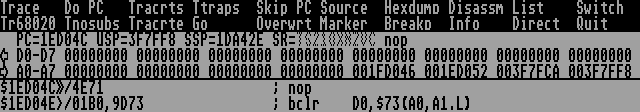
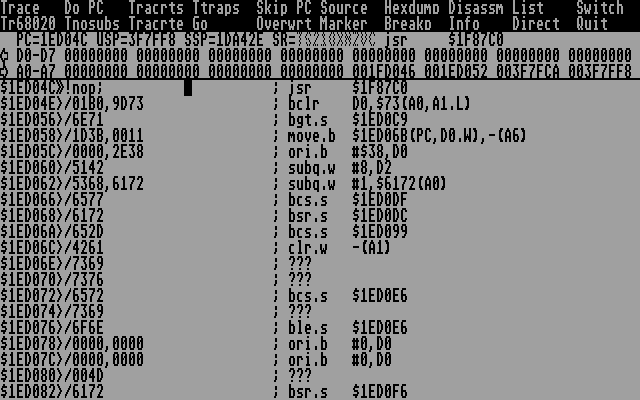
So, let’s say you want to change $1ED04C to have a nice nop instruction instead! What you can do is go to a clean line in the CLI (navigate using the cursor keys) and write the following:
(the ‘;’ is essential if the line is not 100% and contains some other characters after our opcode) Press Return and voila! Instruction changed!
If you don’t remember the hex value of the opcode you can of course use:
After pressing enter you’ll immediately see the change:
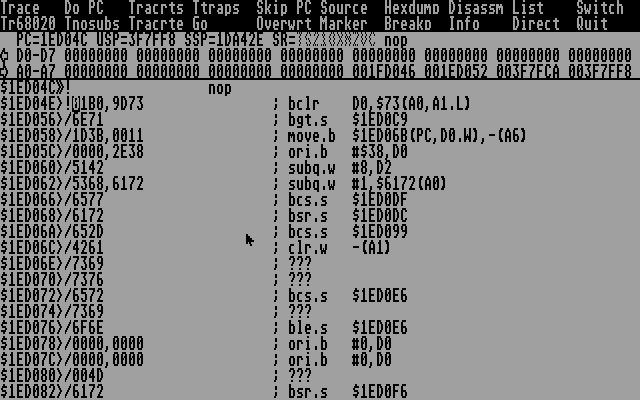
It is a personal preference of mine to end the commands I enter using a ‘;’ because this way I don’t have to worry about finding an empty line or cleaning it up.
- Switch (F10): Switches between Bugaboo’s screen and the user screen.
Let’s take a small break here and discuss some stuff. Bugaboo is a highly crash-proof debugger. It manages that by hooking to every vector possible (just about) and using its own custom interface, keyboard interrupt, mouse driver, palette, etc. So games that disable vectors don’t actually do anything to Bugaboo, as it switches between states (debugger mode, user mode) every time that is needed (i.e. when you trace an instruction). Also, any interrupts that the program sets don’t affect Bugaboo at all since too are saved and restored when it’s needed. It’s also reset proof.
- Tractre (Shift-F3): Like F3, but for RTEs. Careful with this!
- Go (Shift-F4): Runs the program until it exits or an exception is reached or a breakpoint.
- Marker (Shift-F6): Lists all defined markers (more on this later)
- Breakp (Shift-F7): Lists all defined breakpoints (later as well)
- Quit (Shift-F10): Exits to the O/S (if you haven’t trashed all memory that is ;))
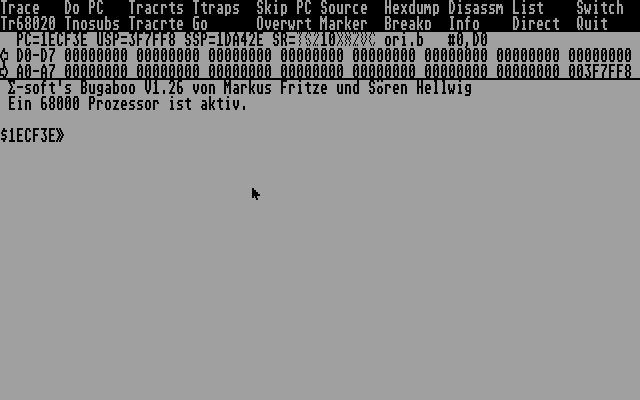
A bit more on the Bugaboo screen
Line 3 of the Bugaboo screen writes the following:

Clicking on any of the 3 numbers in PC, USP, SSP takes the cursor there and lets you change the value on the spot. Clicking on any letter on the SR (except ‘T’) lets you toggle any bits on it. Handy eh? :)
Lines 4 and 5 are like this:

As you expect, if you click on any of those numbers they can be changed.
But, what are the two arrows doing there? Well, this is a very nice feature (unique perhaps?) that for lack of a better term I’d like to call ‘backtracing’. Let’s say you traced through a few instructions and you suddendly realise that you wanted to see what d0 was 5 instructions ago. Oops! Usually this would mean restarting the trace from the beginning, which can get very tedious. But if you click on the left arrow then you can actually see the state of the PC and registers one instruction back! Notice the “close box” character that appears above the arrows when you backtrace.

Bugaboo keeps quite some of those states (32?) and you have the added bonus that you can actually set that state to be the current! What this means is that you can reverse the trace! (of course the memory can’t be altered back) What you need to do to achieve this is click on the “close box” character that appears on the 3rd line (on top of the arrows) when you go back some states. You can also do this by pushing alt+left or right cursor keys, and alt+insert to go back to a previous state.
Now that we covered a few things about the CLI, let’s discuss a few more useful commands. First of all:
Loading stuff into memory
-
The easiest way to enter stuff into Bugaboo is to have Turbo Assembler assemble to the debugger memory! This way when you enter Bugaboo, you have your program ready to be traced, and the PC set up.
-
Another way is to load an executable or data file into memory. But first we need to learn to navigate through the directories using the CLI. When you type DIR at the cli, the directory is displayed in the following format:
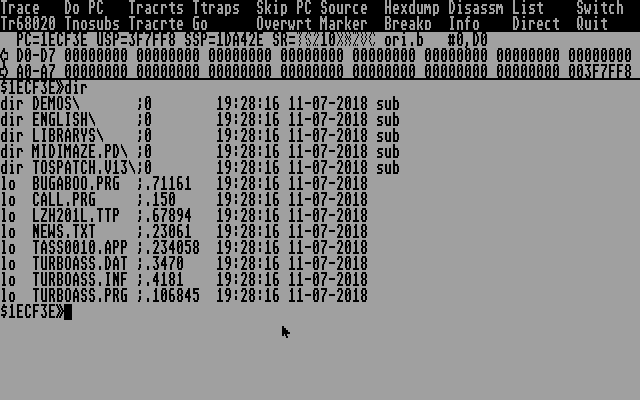
At this point most people that haven’t read the previous text will switch off bugaboo :). But we know better, right? What you might have figured out reading this listing is that these are actulally commands generated to be executed by the CLI by navigating the cursor to the desired line, pressing Return and have the command executed.
The same as before apply: everything after a ‘;’ is discarded and is usually provided for your info, so we’re left with much less stuff than is displayed. So, executing the ‘dir’ commands will actually change the directory path to the one selected and display the directory listing. The ’lo’ command will load a binary file to the address of the PC. Finally the ’le’ command will load the file as a gemdos relocatable file. Bugaboo makes the decision on whether to generate a ’le’ or ’lo’ command by the file’s extension: ’tos’, ’ttp’, ‘app’ and ‘prg’ will generate ’le’ by default. Of course if you know that a file is gemdos executable just change the ’lo’ to ’le’, press return and the file will be loaded as executable.
- Lastly, you can read a sector from disk! The ‘readsector’ command is used for this. It’s syntax is:
readsector <track>,<sector>,<side>,<address>
So, if you want to trace thru a boot demo/game/whatever you can put the disk in drive a and type:
read ,1,,pc
Then set supervisor mode on and start tracing :)
Some more misc stuff on the CLI
If you took a close look at the directory listing above, you must have noticed that after the comment the file’s size, date and time is printed. On the file size you see that the number is prefixed by a ‘.’. This is because Bugaboo parses that as a decimal number. Not using a prefix on a number implies hexadecimal numbers, and a ‘%’ implies binary numbers. Here are some examples:
? 1000+.256+%1;
$1101 .4353 %1000100000001 "...."

save testfile,^a0,^m0+^d0-100;
Save TESTFILE from $100 to $3000 =.12032 Bytes.
Do you want to save? (y/n)

$200000>!move.w #^m0+^m1,d0;
The first example evaluates that expression and prints the result using 3 different formats, for your convenience. The second writes the memory from where A0 points to where marker M0 plus D0 points minus $100. Lastly the third assembles that command to $200000, evaluating the expression and producing the result.
Notice that I use ‘;’ after each command. In practice you’ll understand why! Also, as you see if you want to omit a parameter, just sikp it with a comma.
Another handy hint: If you want to execute an instruction without having to assemble it to memory and tracing thru it you can use the ‘|’. So if you want to move the contents of $ff8240 to d0 (without having to actually produce a mem dump and a set) you can type:
|move.w $8240.w,d0;
This will be executed on the spot.
On newer versions of Bugaboo, you can enter more than one cli command in one line, just separate your commands with a colon :.
Setting variables/breakpoints (~ and LET)
There are lots of stuff that can be set, and fortunately it is done using the same mechanism.
LET <variable>=value ~<variable>=value
(both are equivalent)
So let’s have a few examples of setting stuff:
~b0=PC             ; sets breakpoint 0 at PC
~b1=PC-^a1+^d5+200 ; sets breakpoint 1 at PC - (value of a1) + (value of d5) + $200
~m0=^b0+100        ; sets marker 0 at breakpoint 0 + $100
~m0=.somelabel     ; this works if you have assembled your program with debug symbols on
                   ; note that you have to use the full stop in front of the label
Yay, we finally set some breakpoints . Now, the breakpoint setting has some more tricks under its sleeve. For example:
~b0=PC?^d0=3
will set breakpoint to hit at PC, BUT will only stop execution when d0 is 3. Neat huh?
Another way to set breakpoints (thanks to tIn/Newline for the tip!) is from within your own program. Adding the following to your code:
dc.b $48,$48,";",0
and running the program will cause it to stop when $4848 is encountered and enter Bugaboo. This is the simplest form of this functionality, because any zero terminated string can be used. For example:
dc.b $48,$48,"mem ^a0",0
will halt the program and show a hex dump of the contents of a0.
Finally, after positioning the cursor in a line that has an address and pressing CTRL-B and then prssing any key from 1 to 0 one can set a breakpoint of the same number.
Some misc commands
breakpoints or b
Simply displays all breakpoints
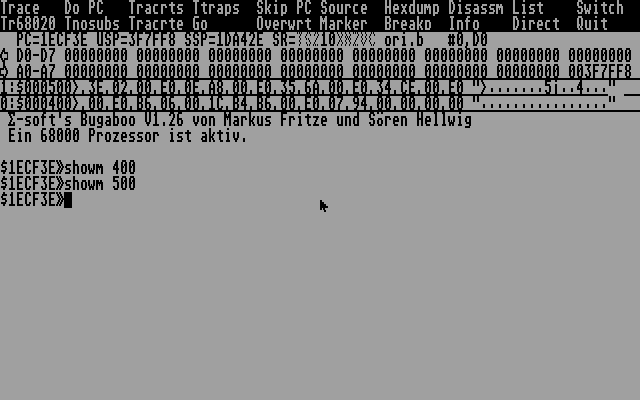
showmemory <mem> or showm <mem>
Sacrifices one line of display to show 16 bytes of consecutive memory. Very handy since everytime you trace an instruction the line gets updated (although this slows speed down a bit).
resident or resi
Makes Bugaboo resident and exits. After that it can be called from Turbo Assembler by pressing F2, or when an exception occurs (handy for debugging GFA inlines ).
observe trap,function
Stops execution when a certain function of a trap gets called.
help
Will give you a listing with all the built-in commands you can use
Some other random things that are nice
- Pressing both shifts when the program is running ceases execution (well of course for programs that steal the keyboard interrupt it won’t work)
- By putting BUGABOO.PRG in the auto folder and rebooting you get Bugaboo resident automatically. If you press a certain combo of alt/shift/ctrl (I usually press all) while it’s loading you can enter Bugaboo without GEM.
- By setting variables col0 and col1 you can change the colour scheme of bugaboo, just provide the rgb value in hex.
- With
? {.mylabel}.wthe value of a variable can be checked w/o using the “m”-command - this outputs the word at address “.mylabel” (".l" instead of “.w” gives you the longword value) directly. - Almost every command can be re-routed into a file by prefixing it with an “F”. This outputs 10 lines of disassembly (starting at the TEXT segment of your loaded PRG) into “disass.txt”:
FOPEN "disass.txt"
FL TEXT#10
FCLOSE
- You can load batch files -
#load "Filename.Bug"loads an ascii file and interprets it’s contents as a series of bugaboo commands. Lines starting with “%” are ignored. Note: the commands DIR, FOPEN, FCLOSE and FORMAT won’t work in a batch file. - To view a text file you don’t have to load it via “LO” - just use
TYPE "readme.txt". - By setting
SET TRACE=1you can force bugaboo to output every trace step in disassembly (d) format (as opposed to the list (l) format) e.g. as/4878 0000 pea 0.winstead of! pea 0.w. - Bugaboo accepts single commands (well, duh!) as well as multiple commands - just use “:” as a delimiter:
m $1234#4:l ^A0". Pretty handy since it executes both commands in direct succession. This works with command line parameters as well as with code breakpoints (the $48,$48 breakpoint, see above) and batch files. Every command will be displayed too, not only it’s output; to mitigate that, use “:-” after a command you’d wish to suppress. This does not work for the first command!m $8#1:m ^A0#2:-l ^A1#4:-outputs the first command string, then 2 lines of memory dump starting at $8, then followed directly by 2 lines of memdump starting at the adress A0 is pointing at followed directly by 4 lines of disassembly listing starting at ^A1. - By closely observing the double right angle bracket “»” on the left side while tracing, one might observe that it changes into a delta (Δ) if the condition of a Scc, Bcc or DBcc is met.
- By adding a left square bracket followed by a byte amount to a memdump command, the output will only contain as many lines as needed to output that amount of bytes
m ^A0[.22. - Bugaboo can be remote controlled via MIDI - just send Scancodes via MIDI and bugaboo will interpret this as keyboard entry.
- By pressing CTRL-1 you can save a bugaboo screen - restore it with ALT-1. Bugaboo can save/restore up to 10 with CTRL/ALT 1-9 and 0.
- CAPS LOCK turns the numpad into a HEXPAD.
- CTRL-SHIFT-HELP will dump a screenshot to disk in Degas format (.PI1/.PI2/.PI3 depending on the resolution). The files are of the format BUG_A.PI2, BUG_B.PI2 etc.